17 Mar Using satellite imagery to manage different landscapes
| Soil, water and vegetation are the major types of land-cover that characterise our environment. Vegetation is fundamental to providing ecosystem goods, such as food, water and wood for fuel, and services, which include climate regulation (CO2 sequestration by plants), water regulation and purification (wetlands) and disease regulation (clean air). | SANSA’s distribution of SPOT-6 and SPOT-7 data sets to public and private sector entities, education and research institutions and the farming community is assisting decision-makers and researchers to manage the country’s different landscapes better and helping farmers to improve and optimise agricultural practices. |
SANSA’s SPOT-6 and SPOT-7 data sets are used by a variety of stakeholders for a wide range of land-cover applications, such as the mapping of human settlements, demographics and public infrastructure, as well as forestry and crop monitoring, water resource management, geological reconnaissance surveys, grazing capacity assessments, land suitability evaluations and electrification and spatial planning. Data users include government departments, public utility companies, private companies and local universities
Satellite data about the condition and dynamics of vegetation also provides critical input for managing a range of landscapes. One of the most common ways to measure the condition of vegetation over large areas is to use imagery from satellite sensors that measure the spectral reflectance of the Earth’s surface from Space.
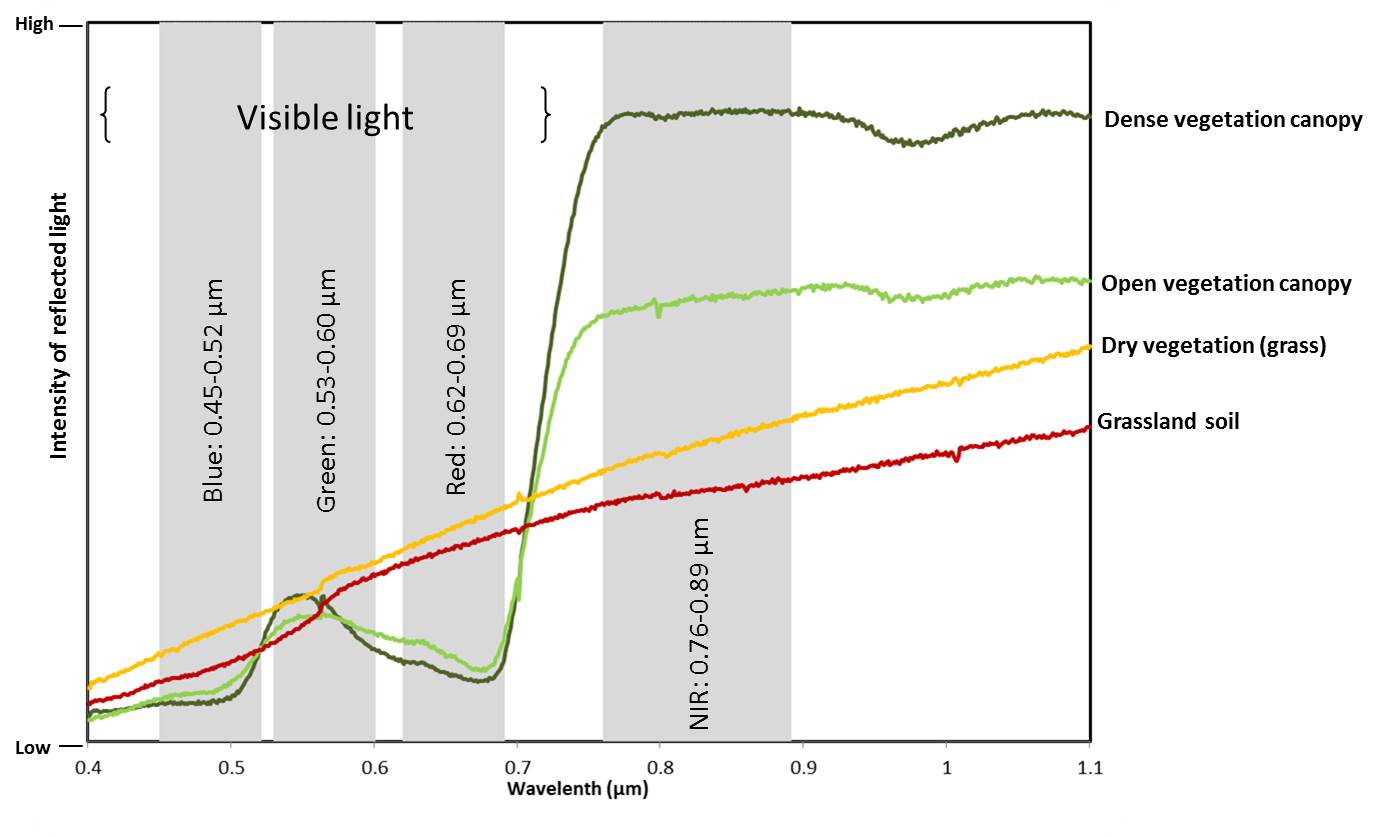
The SPOT-6 and SPOT-7 spectral bands are well configured to assess vegetation spectral measurements, as depicted in Figure 1. The graph shows the intensity of electromagnetic energy, or reflected light, at different wavelengths for a variety of land-cover types, together with the four SPOT-6 and SPOT-7 multispectral bands (Blue: 0.45-0.52 µm; Green: 0.53-0.60 µm; Red: 0.62-0.69 µm; NIR (near infra-red): 0.76-0.89 µm).

Figure 1. SPOT-6 and SPOT-7 spectral bands assess vegetation spectral measurements.
Measuring vegetation vigour
With data from the new SPOT-6 and SPOT-7 satellites, land managers can identify crops and crop areas and monitor crop condition (health and viability). The high spatial resolution of these satellites helps to locate and identify crop stress by analyzing the Normalised Difference Vegetation Index (NDVI). The NVDI or greenness index (increases as the greenness of the vegetation increases) is used widely to measure vegetation vigour. It provides a ratio of visible red light against the spectral signature of vegetation in near infra-red light that ranges from 1 for dense vegetation to ~0 for bare soil and -1 for deep water, as shown in Figure 2.
NDVI analyses are used to develop and implement spot treatment plans that optimise major agricultural applications, such as classifying crop-types, assessing crop condition and the doing seasonal estimations of crop areas.
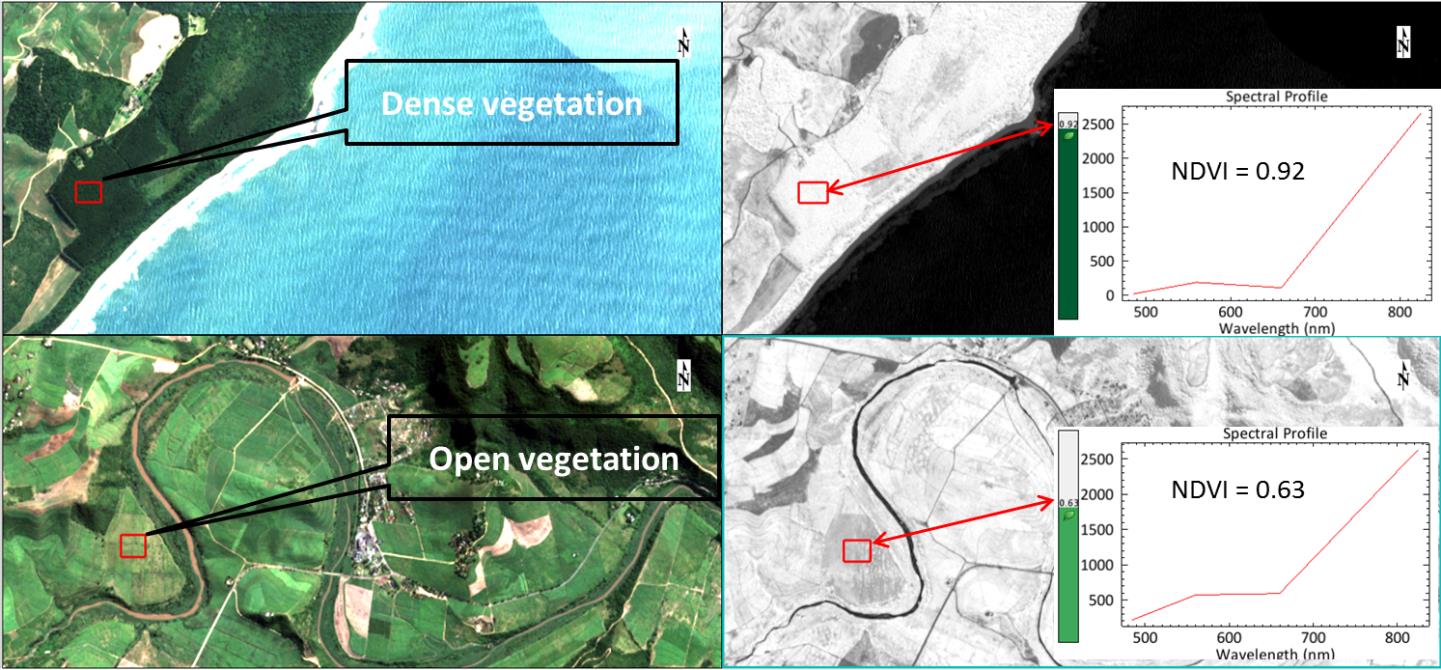
Figure 2. The NVDI or greenness index is used to measure vegetation vigour.
Different NDVI threshold values are used to differentiate vegetation from other land-cover features, as well as assess vegetation abundance and vigour, map water-bodies and provide input in land-cover classification procedures.